A trend is your friend, this simple saying holds a powerful truth in the world of trading: if you can pinpoint which way the market’s winds are blowing, you’re already a step ahead.
But how exactly do you catch these winds? This is precisely where setting your directional bias comes into play.
In this blog, we’ll break down the simple ways to spot the market’s direction. We’ll shed light on some ways that can help in setting up directional bias for any market effectively.
What is Directional Bias and Why is it Important?
Directional bias in trading refers to the expectation that the market or a particular financial instrument will move in a specific direction, either upward (bullish bias) or downward (bearish bias).
Directional bias plays a pivotal role in aligning trading strategies with prevailing market trends.
Understanding and establishing a clear directional bias is essential because trading against the trend can often lead to unfavorable outcomes.
A critical strategy in forming an effective directional bias is to analyze higher timeframes.
This approach guarantees that short-term market movements do not become traps that misleadingly sway the bias, resulting in more consistent and dependable trading decisions.
Synchronizing Directional Bias across all Timeframes
Think of it like making sure all your clocks are set to the same time.
If you want to buy (go long) based on what you observe in a 15-minute (15M) chart, it is vital to first check that the longer trend, daily timeframe for instance, agrees and is also pointing upwards (bullish).
If the big picture is bullish but the 15M chart shows prices dropping (bearish), there’s a good chance the trade might be stopped out or worse miss out on a larger move.
When traders make sure their trading decisions align from the short-term all the way to the long-term, they move with the market’s overall flow, which can lead to better and more confident trading decisions.
One example has been illustrated below:

In the example above, the 4-hour (4H) chart where the directional bias is bullish, paints a picture of an overall upward trend.
Yet, when you zoom into the 15-minute (15M) timeframe, a break in the market structure could tempt a trader to consider taking a short position, expecting the market to go down.
However, this move could lead to a less-than-ideal outcome.
With the groundwork laid, let’s now delve into the various ways through which traders can identify the directional bias.
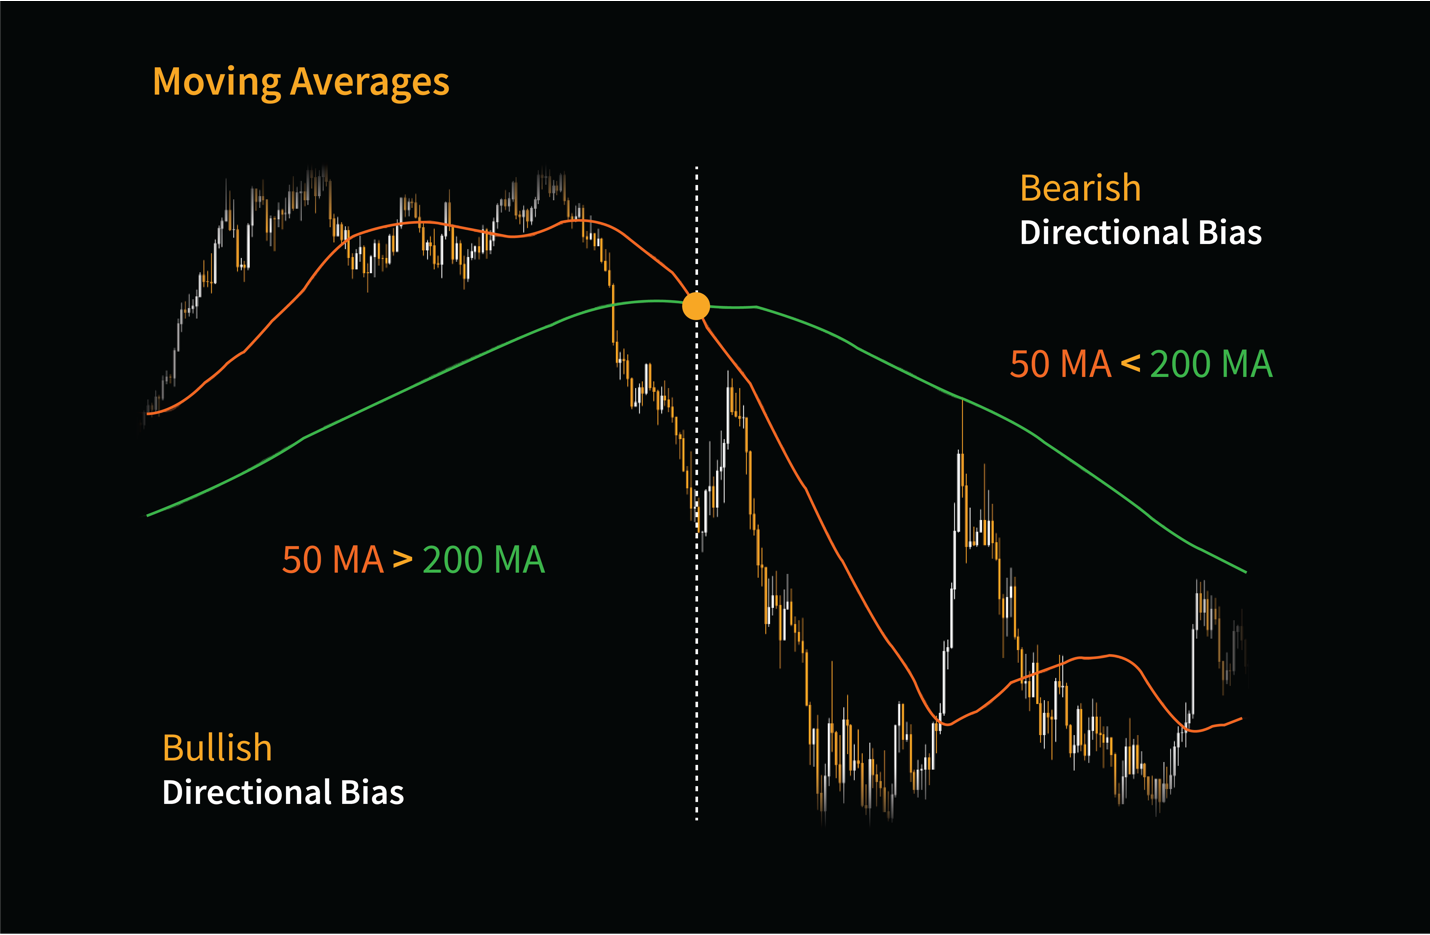
Moving Average (MA)
Moving averages are commonly used in swing trading to identify trends, potential entry and exit points, and to filter out market noise.
Moving averages signal potential entry and exit points through what is known as crossovers. A bullish crossover occurs when a shorter-term moving average ascends past a longer-term moving average.
Conversely, a bearish crossover — suggesting it might be time to sell — happens when the shorter-term moving average dips below its longer-term moving average.
However, Moving Averages can also be used to determine directional bias.
It is ideal to use 200 MA as the 200-day moving average effectively measures a financial instrument over the last 200-day period. It explains the long-term trend of the particular instrument and depicts its price strength.
In the image below 50-day MA has crossed below 200 MA, hence an indication of a potential shift in directional bias from bullish to bearish.
William’s Alligator
Let us now explore another useful Indicator that can help to determine the directional bias.
Developed by Bill Williams, this indicator is based on the understanding that markets trend approximately 30% of the time, while the remaining 70% is spent in consolidation.
Therefore, this tool is particularly effective on higher time frames like the daily or weekly charts, where it can be instrumental in identifying the directional bias of any financial instrument.
The idea behind this indicator is to observe when the market is in a consolidated range and execute as soon as it starts trending. Our main goal is to identify the bias of longer-term trends.
Let us now briefly explain the Alligator Indicator.
- The green line is the 13-period smoothed moving average which is called the ‘Jaw’ of the Alligator.
- The red line is the 8-period smoothed moving average which is called the ‘Teeth’ of the Alligator
- The blue line is the 5-period smoothed moving average which is called the ‘Lips’ of the Alligator.
The consolidated range is observed when the 3 balance lines (jaw, teeth, and lips) cross each other which indicates a period of sideways movement. This is where the directional bias of any financial instrument is indecisive.
Demonstrated below is an image where we identify a Bearish Directional Bias:

Support and Resistance
Price piercing through significant support and resistance structures serves as a potent indicator for establishing a directional bias in the market.
Bearish Directional Bias (Closing Below High Time-Frame Support):
The price closing below substantial high time frame support structures signals a shift towards a bearish bias. This indicates a potential downtrend, where sellers may be gaining control, leading to lower price levels.
Bullish Directional Bias (Closing Above High Time-Frame Resistance):
The price closing above significant high time frame resistance structures establishes a bullish directional bias. This suggests a potential uptrend, with buyers taking charge and pushing prices higher.
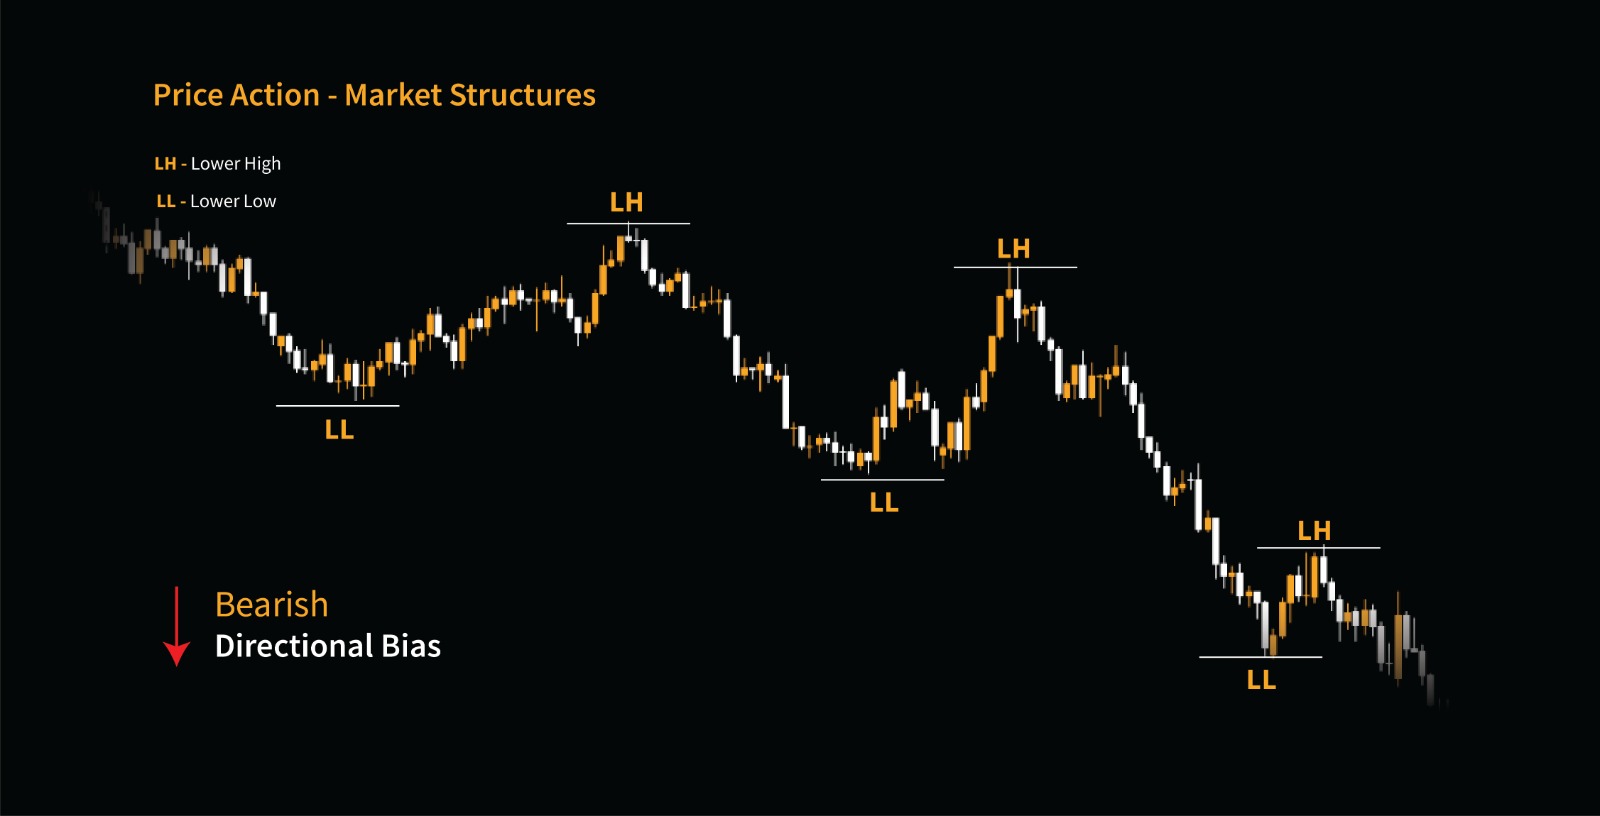
Price Action – Market Structures
To identify directional bias through price action, one must learn to read the market’s own language of highs and lows.
A series of higher highs coupled with higher lows speaks volumes about a bullish sentiment taking hold of the market, signaling an uptrend.
Conversely, a sequence of lower highs and lower lows indicates a bearish bias, signifying a downtrend.
By observing and interpreting these shifts in market behavior, traders can effectively establish the directional bias and align their strategies accordingly.
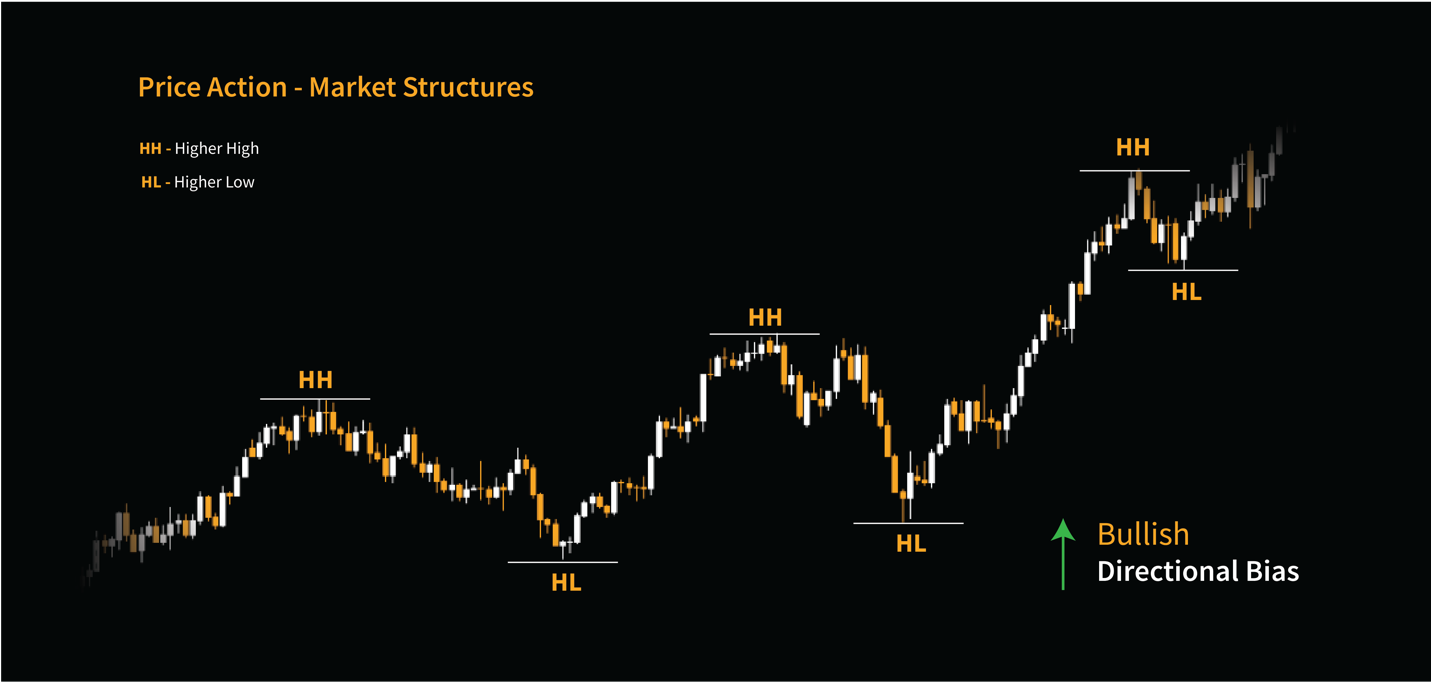
As demonstrated in the example above, each ‘Higher High’ represents a peak where the price has surged beyond the previous high, signaling increased buyer momentum.
Meanwhile, each ‘Higher Low’ reflects a momentary pullback in price that doesn’t dip as low as the previous low, suggesting that buyers are stepping in earlier each time, eager to keep the trend alive.
This pattern is an example of a bullish directional bias, revealing a market that is consistently gaining value. Vice versa for bearish directional bias.
Addressed in this blog are a few of the many technical indicators that can be used to identify the longer-term direction of any financial instrument.
Market Sentiment Analysis
Another crucial aspect of establishing directional bias is understanding market sentiment. Market sentiment refers to the overall attitude of investors towards a particular market or asset.
This sentiment can be bullish, bearish, or neutral and is often influenced by various factors such as economic data, geopolitical events, and investor behavior.
Traders can gauge market sentiment through sentiment indicators, news sentiment analysis, and social media sentiment tracking.
By monitoring sentiment indicators like the put/call ratio, the Volatility Index (VIX), or surveys of investor sentiment, traders can gain insights into whether the market is leaning towards optimism or pessimism.
Additionally, analyzing news sentiment using natural language processing techniques can help identify prevailing market narratives and sentiments.
Social media sentiment tracking tools can provide real-time insights into how market participants are feeling, allowing traders to align their directional bias with the prevailing sentiment.
Macro Economic Analysis
In addition to technical analysis and market sentiment, macroeconomic analysis plays a significant role in determining directional bias.
Macroeconomic factors such as interest rates, inflation, GDP growth, and geopolitical events can influence the overall health of an economy and, consequently, the direction of its financial markets.
Traders can analyze economic indicators and central bank policies to assess the broader economic environment and anticipate potential market movements.
For instance, if central banks signal a hawkish stance by raising interest rates to curb inflation, it may indicate a bearish bias for equities and a bullish bias for currencies.
Conversely, accommodative monetary policies aimed at stimulating economic growth may suggest a bullish bias for equities and a bearish bias for safe-haven assets like gold.
By integrating macroeconomic analysis with technical analysis and market sentiment, traders can develop a well-rounded understanding of directional bias and make informed trading decisions.
To Conclude
In our exploration of the markets, we’ve navigated the vital concept of directional bias, uncovering the tools and indicators that light our path.
Identifying directional bias through price action such as Support and Resistance levels, Moving Averages, and Alligator Indicators can help to drastically improve trading decisions.
For those eager to dive deeper into captivating trading insights, our collection of recently published blogs awaits your curiosity. Continue your educational journey by exploring our latest articles.